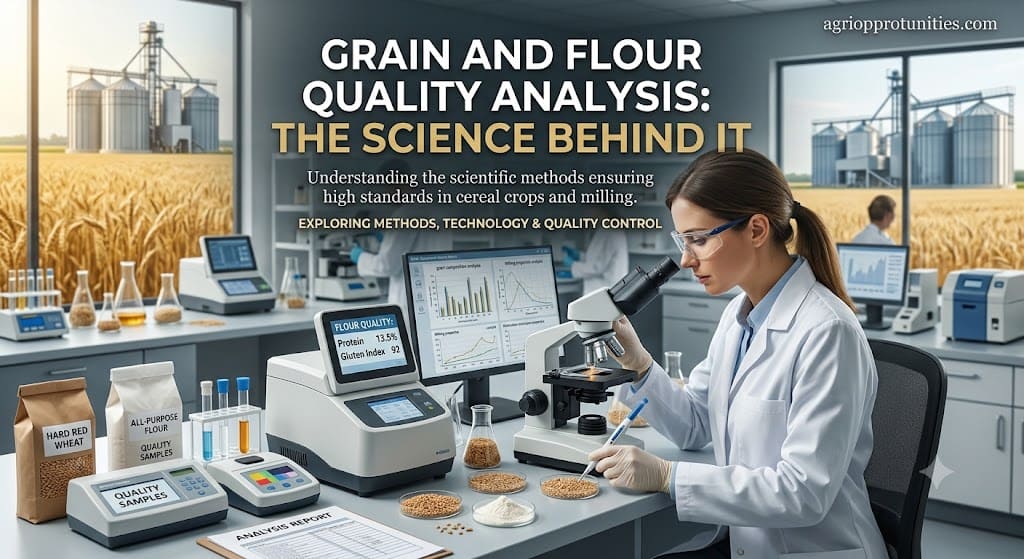
Grain and Flour Quality Analysis: The Science Behind It

Grain and Flour Quality Analysis
The science behind moisture, test weight, falling number, gluten strength, and dough rheology — and why each parameter directly affects pricing and end use.
Grain and Flour Quality Analysis: The Science Behind It
Every sack of wheat that arrives at a mill or grain trading facility goes through a battery of tests most consumers never think about, yet these tests directly determine both the price a farmer receives and what that grain can eventually become — bread, biscuits, pasta, or animal feed. I want to walk through what these tests actually measure and why each one genuinely matters, because grain quality analysis is a lot more technically rich than a simple pass-fail inspection.

Moisture Content: The First and Most Basic Test
Moisture content is measured as a simple percentage — how much water weight the grain carries — and it’s determined through basic weight-loss testing, where a sample is dried and the resulting weight loss expressed as a percentage.
Why Moisture Matters for More Than Just Weight
Moisture content is a genuinely critical indicator of storability, not just a pricing consideration. Wheat or flour carrying moisture content above roughly 14.5 percent becomes considerably more vulnerable to mold, bacteria, and insect infestation during storage — meaning a grain lot that tests fine on delivery day can still deteriorate seriously in storage if its moisture level sits above this threshold, independent of any other quality characteristic.
Test Weight: Why Density Predicts Milling Yield
Test weight measures grain density within a standard volume (traditionally expressed per bushel), and it serves as the primary quality indicator used for official grading. The underlying reason it matters so much: test weight is a direct proxy for how much flour can actually be extracted during milling.
What High and Low Test Weight Actually Indicate
Wheat with high test weight generally consists of large, plump, well-filled kernels — exactly the physical characteristic that translates into strong milling yield. Lower test weight, by contrast, often signals shriveled or immature kernels, which mill less efficiently and produce a lower flour yield from the same volume of grain, directly affecting a mill’s economics.
Protein Content: The Parameter That Shapes End Use
Protein content is reported on a standardized moisture basis (commonly 12 percent) to allow fair comparison between samples with different moisture levels, since protein percentage would otherwise vary artificially depending on how much water weight is diluting the measurement.
How Growing Conditions Shape Protein Levels
Protein content isn’t a fixed genetic trait alone — growing conditions genuinely influence it. Cool, wet conditions during grain fill tend to produce lower grain protein content and weaker gluten properties, while warmer, drier finishing conditions generally push protein levels higher, a pattern directly relevant to the dryland farming and climate variability themes covered elsewhere on this site.
Why Different Wheat Classes Target Different Protein Ranges
Protein content directly determines which end products a specific wheat lot is actually suited for. Soft wheat classes, characterized by low protein (roughly 8.5 to 10.5 percent), soft endosperm, and weak gluten, are specifically used for pastries, cakes, cookies, crackers, pretzels, and flatbreads — products where a strong, elastic gluten network would actually be undesirable, since it would make the dough too tough for these delicate baked goods. Hard wheat classes, by contrast, carry higher protein and stronger gluten, making them suited for bread and other products requiring a robust, elastic dough structure.
The Falling Number Test: Detecting Hidden Sprout Damage
This is one of the more technically interesting tests in the entire quality panel, and it detects a problem that isn’t visible simply by looking at the grain. The falling number test measures alpha-amylase enzyme activity — an enzyme that becomes active when a wheat kernel has begun to sprout, even minimally, changing the physical properties of the starch inside the kernel.
How the Test Actually Works
Wheat is milled into flour, and a standard amount is combined with a standard amount of water in a test tube, heated for a defined period while being gently agitated. A standardized plunger is then allowed to fall through the resulting paste, and the time it takes to fall — measured in seconds — is the falling number.
Reading the Result
A high falling number, generally above 300 seconds, indicates minimal enzyme activity and sound, undamaged grain quality. A low falling number, generally below 250 seconds, indicates substantial enzyme activity, meaning the grain has suffered sprout damage that will seriously affect baking performance — sprout-damaged flour tends to produce sticky, poorly structured dough and bread with a gummy crumb, even though the grain may look entirely normal to the naked eye.

Gluten Testing: Content Versus Quality
This is a genuinely important distinction that’s easy to conflate. Gluten content measures how much gluten-forming protein is actually present in a flour sample, commonly expressed as a wet or dry gluten percentage. Gluten quality — assessed separately, often through a gluten index test or mixograph scoring on a 1 to 8 scale — measures how strong and elastic that gluten actually is.
Why This Distinction Genuinely Matters
A wheat variety can carry a relatively low protein quantity while still exhibiting strong, high-quality gluten characteristics — meaning protein percentage alone doesn’t fully predict how a flour will actually perform in dough. This is precisely why comprehensive quality analysis tests gluten content and gluten strength as separate, distinct parameters rather than relying on protein percentage as a single proxy measurement.
What the Gluten Index Actually Tells You
A gluten index score near 100 indicates very strong gluten, while scores below 60 suggest weak or degraded gluten — and this specific test becomes particularly useful when falling number results indicate enzyme activity issues, since gluten index can help clarify exactly how much that enzyme damage has actually degraded the dough-forming protein structure.
Water Absorption: Measuring How Much Water Flour Needs
Water absorption measures how much water flour requires to reach a standard dough consistency. Millers and researchers determine this value with a farinograph and report it as milliliters of water per 100 grams of flour. Higher water absorption generally produces better bread yield and a softer crumb because the flour holds more water in the finished product.
What Drives Water Absorption
Several factors affect water absorption. Higher protein content generally increases it, while starch damaged during milling absorbs additional water. Finer flour particles also absorb water more quickly and in greater amounts. Before comparing samples, analysts adjust each flour’s moisture content to a standard 14% moisture basis to ensure consistent results.
Rheology Testing: Understanding How Dough Behaves
In addition to measuring individual flour components, rheology tests evaluate how dough responds during mixing, fermentation, and baking. These tests help millers, bakers, and food scientists predict baking performance more accurately than compositional tests alone.
The Farinograph
The farinograph measures more than water absorption. It also tracks dough development and mixing tolerance over time, showing how the dough develops during mixing and how well it maintains its consistency under continued mechanical stress.
The Extensigraph
The extensigraph measures dough resistance to stretching and how far the dough extends before breaking. These measurements help bakers assess dough strength and elasticity, which influence its ability to retain gas, expand during proofing, and maintain its structure during baking.
The Alveograph
The alveograph measures how much pressure dough can withstand as air inflates it into a bubble and how readily the bubble expands before rupturing. These measurements help assess dough strength, extensibility, and elasticity, providing useful insights into how dough may behave during fermentation and baking.
The Mixograph
The mixograph records dough development and mixing characteristics, helping researchers assess flour quality and gluten strength. However, results can become difficult to interpret for soft wheat flours with protein contents at or below 8.5 percent, depending on the flour characteristics and testing method. For these lower-protein soft wheats, the Solvent Retention Capacity (SRC) test provides complementary information about flour functionality by measuring its ability to retain selected solvents. Unlike the mixograph, SRC does not rely on dough mixing and helps evaluate properties associated with gluten, damaged starch, and arabinoxylans.
Mycotoxin and Contaminant Testing
Beyond physical and chemical quality measurements, grain testing also assesses food safety hazards. Laboratories may screen for mycotoxins such as aflatoxins, deoxynivalenol (DON, also known as vomitoxin), and fumonisins, which certain fungi produce and which can pose risks to human and animal health. Depending on the grain’s intended use and applicable regulations, laboratories may also test for pesticide residues and other contaminants. These checks connect directly to the food safety risk assessment and pesticide registration topics covered elsewhere on this site.
Why Sub-Lot Consistency Matters as Much as the Average
A detail worth knowing from official grading standards: when a maximum protein specification is set for a shipment (for example, a maximum of 10.0 percent), the requirement isn’t just that the overall lot average stays under that threshold — no individual sub-lot within the shipment can exceed a defined tolerance above that maximum, and all sub-lots must fall within a defined range of each other. This matters because a single unusually high-protein sub-lot blended into an otherwise compliant shipment could otherwise mask genuine inconsistency that would affect downstream baking performance in unpredictable ways.
Why This Matters for a Career in Grain Quality Analysis
Understanding this full testing panel properly — not just running the tests, but genuinely understanding why each parameter matters for a specific end product — is exactly what separates a strong quality analyst from someone simply operating laboratory equipment. Given how directly these results affect pricing, contract compliance, and a mill’s ability to guarantee consistent product quality to its own customers, this is a genuinely technical, well-respected specialization within the broader agribusiness supply chain career track covered elsewhere on this site.
For current openings in grain quality analysis and food science roles in Pakistan, browse live agriculture job listings on Agri Opportunities.
Build a Career in Grain Quality Analysis
Food science and grain quality roles are a growing specialization in Pakistan’s agribusiness sector. From moisture testing to dough rheology — grain analysts play a critical role in determining crop value, mill efficiency, and food product quality.
Explore grain quality and food science jobs in Pakistan →Frequently Asked Questions
What is the falling number test and why does it matter?
The falling number test measures alpha-amylase enzyme activity in wheat or flour by timing how long a plunger takes to fall through a heated flour-and-water paste. A high falling number, above roughly 300 seconds, indicates minimal enzyme activity and sound quality, while a low falling number, below roughly 250 seconds, indicates sprout damage that can seriously affect baking performance.
What is the difference between gluten content and gluten quality?
Gluten content measures how much gluten-forming protein is present in a flour sample, while gluten quality, often assessed through gluten index or mixograph scoring, measures how strong and elastic that gluten actually is, since a flour can have a relatively low protein quantity but still exhibit strong, high-quality gluten.
Why does test weight matter for grain pricing?
Test weight measures grain density within a standard volume and serves as the primary quality indicator used for grading, because it reflects how much flour can actually be extracted during milling, with high test weight generally indicating large, plump, well-filled kernels.
Why does moisture content matter beyond just weight and pricing?
Moisture content is also a critical indicator of storability, since wheat or flour with moisture content above roughly 14.5 percent becomes considerably more vulnerable to mold, bacteria, and insect infestation during storage, independent of any pricing considerations.
Add Agri Opportunities as a preferred source on Google to see latest blog listings first.




Good work Haji sons